

Custom Search
|
|

|
||
 (i) Using linear regression, calculate the equation for the best fitting
s t r a i g h t l i n e a n d s o l v e f o r Qn o m i n a l.
( Qn o m i n a l i s d e f i n e d a s n o r m a l
o p e r a t i n g pressure.)
I n determining the air losses, use the following mass l o s s
5 . 1 Test Formula.
formula.
Q = 35.852 V
(a)
( Pi- Pf)
( T + 4 6 0 ) ( t f- ti)
= v o l u m e t r i c airflow (scfm)
Where:
Q
V
=
v o l u m e of tank, ft 3
T
=
temperature, F
=
p r e s s u r e , psig
P
=
t
t i m e , minutes
=
i
initial
=
f
final
( b ) Although the regression equation can be calculated by hand, the
c a l c u l a t i o n s are quite laborious. It is strongly recommended that an
i n e x p e n s i v e hand-held calculator with statistics capability or an in-house
computer program be used as the information can then be rapidly and accurately
calculated.
T h e following example illustrates the pressure decay test
5 . 2 Example.
procedure.
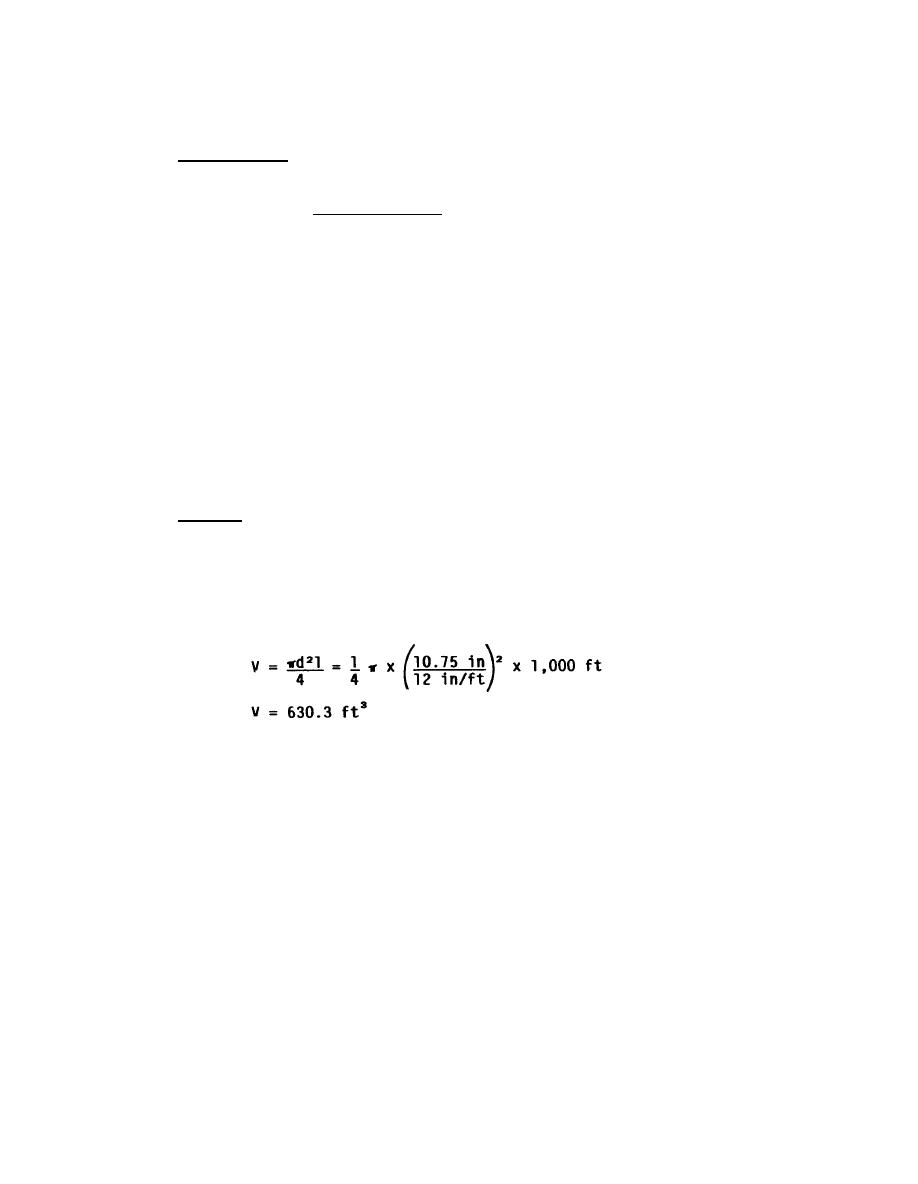
( a ) A section of 10-inch compressed air line is suspected of leakage.
T h e line is located on drawings and verified by a field inspection. Using an
e n g i n e e r i n g scale and the drawing, the length of line is found to be 1,000
f e e t . C a l c u l a t i n g the volume of the line:
( b ) A pressure gauge is installed on the line at an outlet valve, and
a l l loads on the line are secured. With a person watching the gauge, the line
i s i s o l a t e d f r o m t h e ce n t r a l air distribution system.
( c ) The pressure
g a u g e , which had indicated 96 psig, begins to fall
i m m e d i a t e l y . When the
g a u g e reaches 90 psig, the stopwatch is started. Time
i n t e r v a l s as shown in table 5-3. (A stopwatch with a
i s recorded at 10-psi
lap counter makes this
easier.)
(d) Assuming an ambient temperature of 68F, the losses can be
c a l c u l a t e d for each pressure interval, using equation 5.1(a). R e s u l t s are
shown in table 5-4.
(e) The data can be plotted as shown in figure 5-2 to determine how well
t h e t e s t d a t a f i t s a s t r a i g h t l i n e . A l t h o u g h test data from an actual test
w i l l normally be offset from a straight line to some degree, severe deviations
w i l l require that the test be repeated.
5-19
|
 
|
|
|
||


