

Custom Search
|
|

|
||
 solid waste are unavailable, although some state and local governments have characterized
one or more of these other components within their jurisdiction. Under RCRA section 6002,
EPA considers materials recovered or diverted from any component of solid waste for
purposes of designating items containing recovered materials.
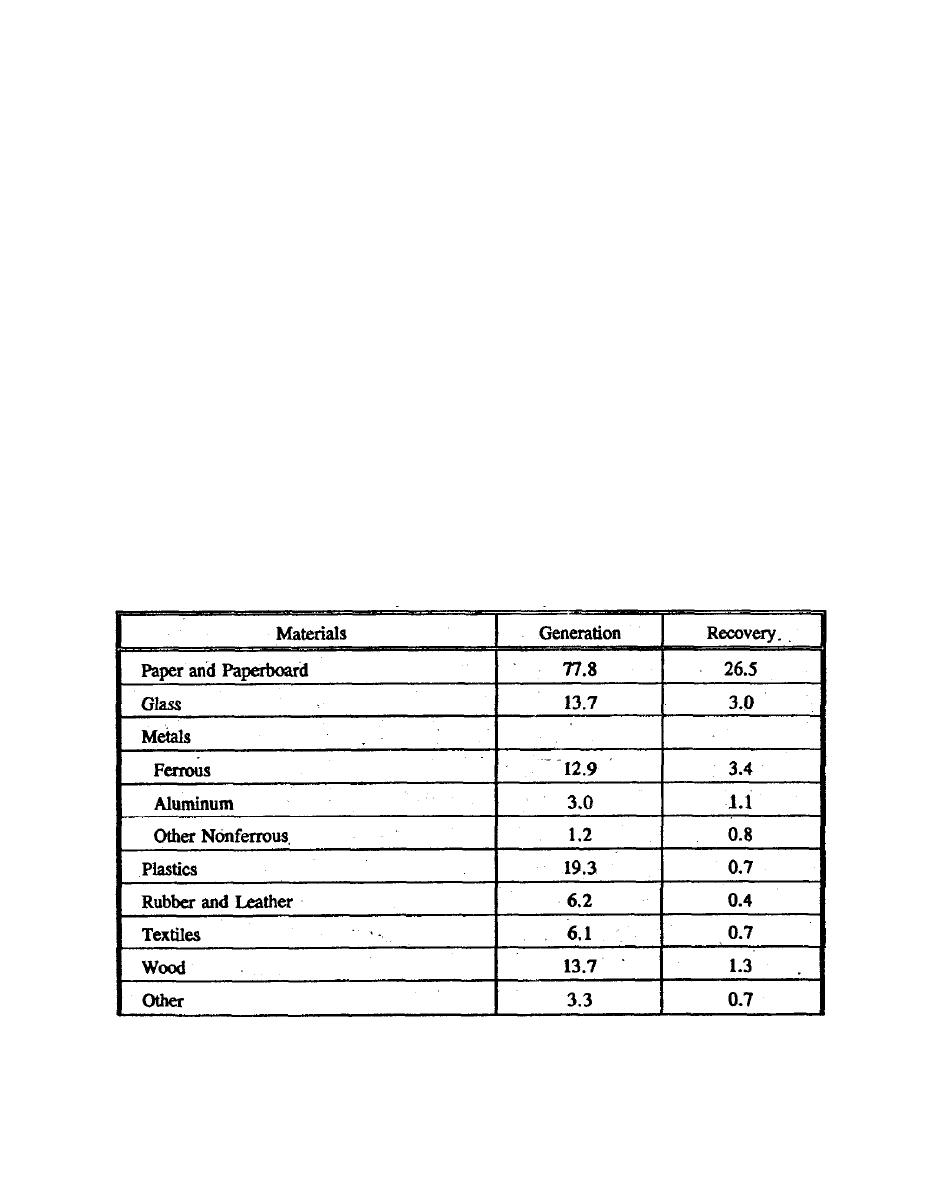
EPA's latest municipal solid waste characterization study, which presents 1993 waste
generation and recovery data, addresses the following materials: paper and paperboard,
glass, metals, plastics, rubber and leather, textiles, wood, food wastes, yard trimmings,
miscellaneous inorganic wastes, and other materials. Table 3 shows the 1993 generation and
recovery of these materials. The largest components of the municipal solid waste stream are
paper and paperboard (37.6 percent), yard trimmings (15.9 percent), plastics (9.3 percent),
and food wastes (6.7 percent). Glass and wood wastes each account for 6.6 percent of the
municipal solid waste stream. Paper, paperboard, and yard trimmings alone accounted for
over 53 percent of the materials generated in 1993.
EPA's existing procurement guidelines foster markets for several of the municipal
solid waste components identified in Table 3 -- paper and paperboard, rubber (tires), and
plastics and glass (used in building insulation) -- as well as used oil and fly ash generated by
coal burning utilities. The revisions and new item designations issued in the CPG address
paper, plastics, glass, yard trimmings, wood, rubber, and other materials.
Table 3
Materials Generation and Recovery in the U.S. Municipal Waste Stream, 1993
(In Millions of Tons)
6
|
 |
|
|
||


