

Custom Search
|
|

|
||
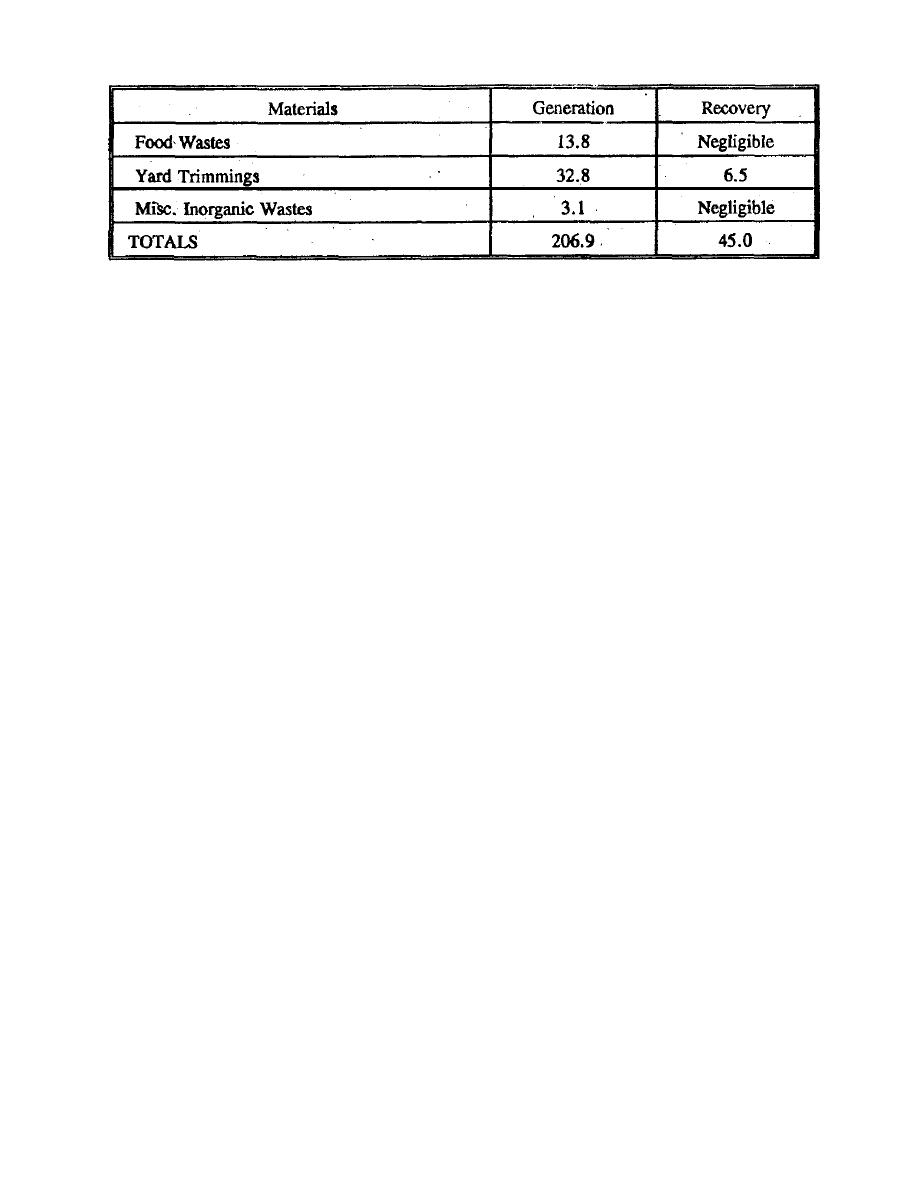 "Characterization of Municipal Solid Waste in the U.S.: 1994 Update," U.S.
Source:
EPA, EPA 530-R-94-642, November 1994.
1. Paper and Paperboard
As shown in Table 3, paper and paperboard are major components of the solid waste
stream. In 1993, the municipal waste stream included nearly 78 million tons of waste paper;
or 38 percent of total municipal solid waste generated. Paper waste includes office papers,
newspapers, corrugated containers and other paper packaging, and a mixture of other papers
(e.g., direct mail). In 1993, the United States generated nearly 13 million tons of
newspapers, over 7 million tons of office papers, and over 35 million tons of paper and
paperboard containers and packaging.
A significant portion of paper is recovered and used in the manufacture of new paper
and paperboard products. According to the American Forest & Paper Association (AFPA),
the American paper industry recovered nearly 40 percent of paper and paperboard generated
in the U.S. in 1993, or approximately 36 million tons. Of this, 28.9 million tons were used
in U.S. mills to make recycled paper and paperboard products, 1.15 million tons were used
in the manufacture of other products, and 5.9 million tons were exported Table 4 provides
the tonnage of various grades of paper and paperboard recovered in 1993, as reported by
AF&PA. These figures include pre-consumer materials (e.g., converting scrap, over issues,
etc.) which are not taken into account in the EPA figures for paper and paperboard shown in
Table 3.
7
|
 |
|
|
||


