

Custom Search
|
|

|
||
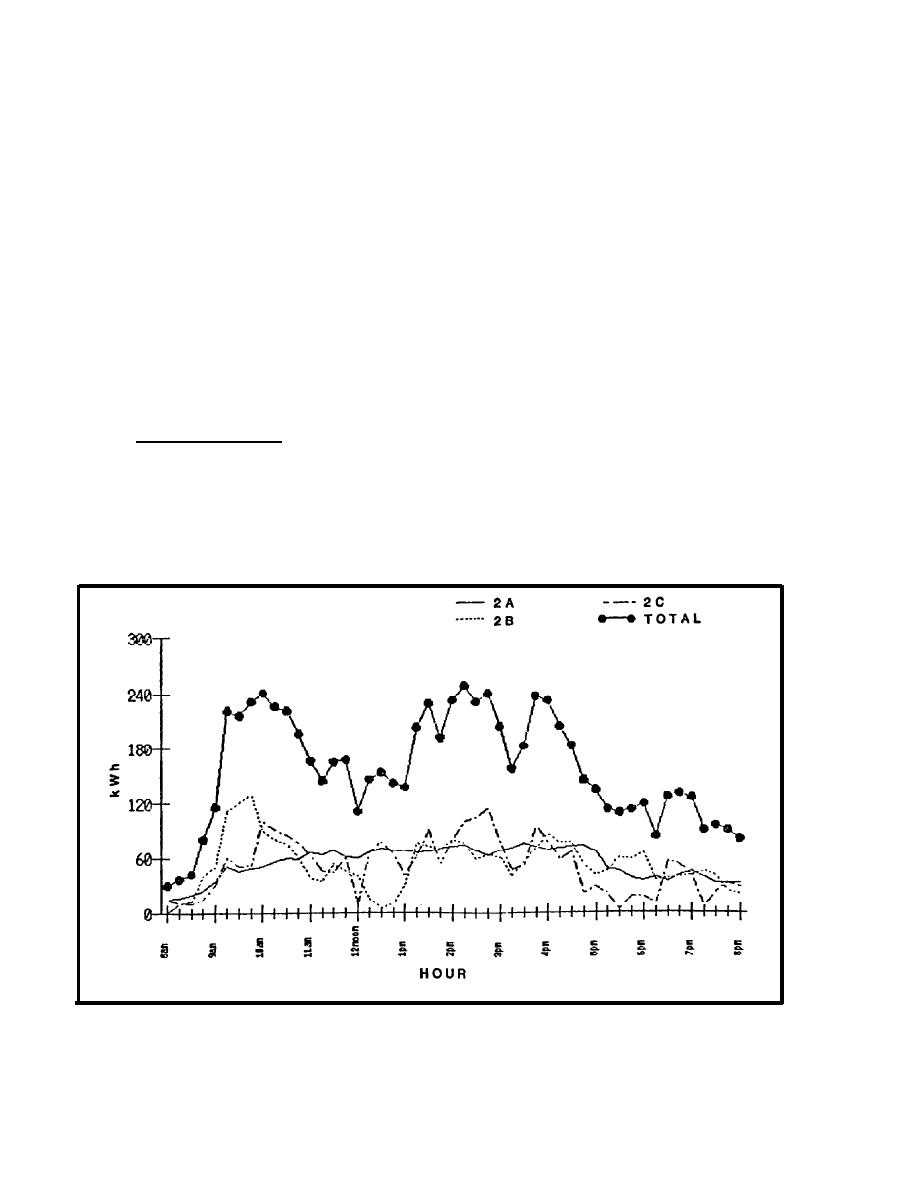 2.1.3 Profile Analysis. In Figure 9-19 the peak demands occur around 10:00
AM and during the period from 1:00 PM to 5:00 PM. After the morning buildup,
feeders 2A and 2C show level demand, with the substation peaks being
principally caused by erratic loading of feeder 2B. If the demand on feeder
2B is made up of many small loads, then a better time distribution of these
loads would level demand on this feeder and consequently on substation No. 2.
Other possibilities are to shift loads on feeders 2A and 2C away from the
peaks of feeder 2B, or to transfer some of the peak loads on any of the
feeders to second shift. If these steps are not possible, then the peaks from
this substation could be mated to the valleys from other substations.
2.1.4 System Management. Developing a series of plots for an entire facility
and designating the principle loads on the plots, gives a clear picture of the
overall demand situation, building from the base of the pyramid to the peak.
Such information is invaluable in developing procedural steps that reduce
demand charges or developing an energy management system program.
2.2 Periodic Studies. It is important to remember that changing market
forces and equipment requirements create needs to modify a system load
makeup. Therefore, periodic studies should be carried out, at least at the
utility service entrance, to make sure that gains from a previous energy audit
are not outdated.
FIGURE 9-19.
Demand Profiles
9-44
|
 |
|
|
||


